National Developer (India): Benchmarked 47 buildings, identified ₹1.8 Cr/yr in potential energy savings

The challenge of tracking occupancy across 5,00,000 sft. Is never an easy one. Background and contex...
Portfolio Intelligence for Real Estate Leaders
Maximise Portfolio Performance with One Intelligent Platform. Unify operations, insights, and impact from individual buildings to portfolios across cities.
Nhance helps landlords and property leaders shift from reactive management to data-driven control.
Monitor performance, benchmark across properties, and make smarter capital decisions in real-time. It’s your digital command centre for operational excellence and asset value growth.
Nhance helps landlords and property leaders shift from reactive management to data-driven control.
Monitor performance, benchmark across properties, and make smarter capital decisions in real-time. It’s your digital command centre for operational excellence and asset value growth.
Nhance helps landlords and property leaders shift from reactive management to data-driven control.
Monitor performance, benchmark across properties, and make smarter capital decisions in real-time. It’s your digital command centre for operational excellence and asset value growth.
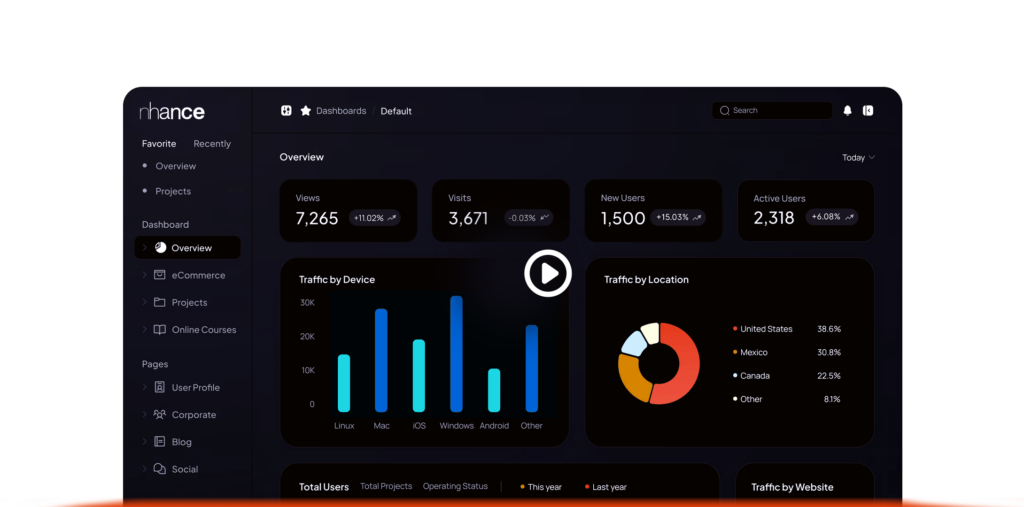
Monitor performance across properties with live dashboards, smart alerts, and automated reporting. Stay ahead of downtime, compliance gaps, and cost inefficiencies.
Cross-portfolio performance benchmarking (energy, uptime, cost per sqft).
Live dashboards for each property with custom drill-downs.
Executive reports with automatic monthly/quarterly generation.
Alerts for SLA breaches, non-compliance, or critical systems downtime.
Occupancy vs performance correlation insights.
ESG data aggregation with carbon and IAQ metrics.
Rentable vs operational area heatmaps.
Integration with lease, tenant, and service partner data.
With live data, layered insights, and powerful simulations, get a clear picture of what’s working, what needs attention, and where there’s room to improve.
Real-time integration with BMS, IoT, and energy systems.
Navigate your building virtually for immersive operations.
Overlay IAQ, occupancy, energy, and asset data.
Visualise and control thresholds within the twin.
Spot issues early with AI-driven insights.
Model “what-if” scenarios for energy, occupancy, and asset loads.
Capture design-to-operation data for lifecycle traceability.
Spot issues early with AI-driven insights.
Model “what-if” scenarios for energy, occupancy, and asset loads.
Capture design-to-operation data for lifecycle traceability.
Easily onboard buildings, unify data, and use AI to detect issues. Track performance and progress with real-time dashboards and automated reports.
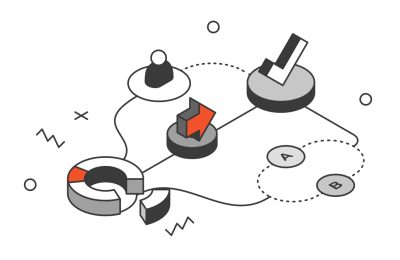
Connect buildings via existing BMS or IoT gateways and unify data.

AI models identify anomalies and performance gaps.
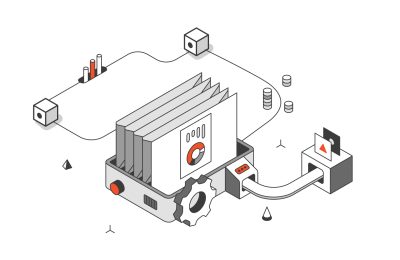
Real-time dashboards track energy, uptime, IAQ, and occupancy.
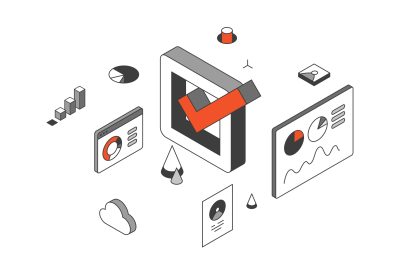
Generate reports and set goals to monitor progress.

Integrate sensor feeds, equipment tags, and system protocols.

Sync spatial geometry with real-time building data.

Enrich the model with live sensor and system performance overlays.

Navigate spaces, detect anomalies, and take action — all from one digital interface.
See every asset clearly, spot risks early, and optimise investments with consistent KPIs—all while driving sustainable, future-ready value.
Understand performance across all assets instantly
Detect operational and compliance gaps early
Make informed decisions on upgrades and investments
Ensure consistent KPIs, reporting, and vendor management
Quicker incident response via real-time visibility
Quicker incident response via real-time visibility
Improved equipment uptime via predictive alerts
Improved equipment uptime via predictive alerts
Our digital twin does more than show data—it
helps you act faster, plan smarter, and keep your
building running smoothly.
Incident response time reduced – 50%
Improved equipment uptime 30 %
Enabled data-driven decisions
Extended design to operations
Our digital twin does more than show data—it
helps you act faster, plan smarter, and keep your
building running smoothly.
Quicker incident response via real-time visibility
Improved equipment uptime via predictive alerts
Enabled data-driven planning for Operations
Extended design-to-operations through digital handover
See every asset clearly, spot risks early, and optimise investments with consistent KPIs—all while driving sustainable, future-ready value.
Understand performance across all assets instantly
Detect operational and compliance gaps early
Make informed decisions on upgrades and investments
Ensure consistent KPIs, reporting, and vendor management
Connects effortlessly with your existing BMS (BACnet, Modbus, MQTT), ERP, CAFM, lease, and financial systems. It also integrates sensor networks, submeters, IAQ monitors, utility APIs, tenant platforms, and ESG frameworks like GRESB and LEED, creating a unified data ecosystem.
Adapt Nhance to your portfolio’s unique challenges with modular features and real-time insights that optimise operations and enhance decision-making across diverse properties.
Nhance delivers measurable savings, compliance, and operational improvements across regions and asset types.
Nhance delivers measurable savings, compliance, and operational improvements across regions and asset types.

The challenge of tracking occupancy across 5,00,000 sft. Is never an easy one. Background and contex...

The challenge of tracking occupancy across 5,00,000 sft. Is never an easy one. Background and contex...

The challenge of tracking occupancy across 5,00,000 sft. Is never an easy one. Background and contex...
Ask Maverick natural language questions like which buildings had the highest downtime, HVAC costs by region, performance reports, or alerts for energy overuse—all answered instantly.
No — Nhance integrates with your current BMS and normalises data across platforms.
Yes — performance is standardised regardless of region or system.
All data is encrypted, with role-based access and compliance with SOC 2, ISO 27001, and GDPR.
Yes — both buildings and service vendors can be ranked based on KPIs.
Yes — scheduled reports are available in PDF, Excel, or dashboard formats.
Absolutely — IAQ, energy, waste, and emissions metrics are included.
Yes — it surfaces patterns you might miss, such as simultaneous heating/cooling or repetitive failures.
Yes — and track progress by building, cluster, or operator.
This is cross-functional and insight-first, not just work order logs.
We offer quick-deploy kits and retrofit sensors for offline sites.